>Corresponding Author : Baojun Xu
>Article Type : Research Article
>Volume : 1 | Issue : 1
>Received Date : 28 October, 2021
>Accepted Date : 15 November, 2021
>Published Date : 19 November, 2021
>DOI : https://doi.org/10.54289/JNNT2100101
>Citation : Bai X, Meenu M, Xu B. (2021) Taurine, Free Amino Acids and 5′-Nucleotides in Oyster Sauce Products Marketed in China. J Nutr Nutr Ther. 1(1): doi https://doi.org/10.54289JNNT2100101
>Copyright : © 2021 Bai X, et al. This is an open-access article distributed under the terms of the Creative Commons Attribution License, which permits unrestricted use, distribution, and reproduction in any medium, provided the original author and source are credited.
Research Article | Open Access | Full Text
Food Science and Technology Program, Beijing Normal University-Hong Kong Baptist University United International College, Zhuhai, Guangdong, 519085, China
#Authors equally contributed to this paper
*Corresponding author: Baojun Xu, Food Science and Technology Program, Beijing Normal University-Hong Kong Baptist University United International College, Zhuhai, Guangdong, 519085, China
Abstract
Oyster sauce is a popular condiment in Southeast Asian countries. In this study, significant differences in taurine, free amino acids and 5′-nucleotides in oyster sauce from China were observed. The higher level of taurine (550.18 mg/100g) was observed in homemade oyster sauce and the lowest amount (7.02 mg/100g) was detected in sample 3. Glutamic acid was a predominant free amino acid in sauce samples. The highest amount (14.75 mg/100g) of total free amino acids was observed in sample 4 and the lowest amount (288.01 mg/100g) was found in sample 10. Majority of the essential amino acids were observed in sample 18. Sample 4 exhibit the highest amount of total 5′-nucleotides (381.16 mg/100g). Whereas, 5′-nucleotides and Taurine were not detected in sample 10. The finding of present study revealed that some of the samples found to be consistent with the claim of being prepared by traditional processing method and sample 10 was prepared by using additives instead of oyster extracts.
Keywords: Oyster sauce; taurine; free amino acids; 5'-nucleotides.
Abbreviations: 5′GMP: 5′-guanosine monophosphate, 5′-IMP: 5′-inosine monophosphate, 5′-AMP: 5′-adenosine monophosphate, Hx: hypoxanthine, PITC: Triethylamine and phenylisothiocyanate, EUC: monosodium glutamate equivalent.
Introduction
Oyster sauce is a popular condiment used in China, Thailand and Philippines as a flavoring agent in several dishes. Traditionally, oyster sauce is prepared by boiling fresh oysters and addition of soy sauce, salt and certain spices. Oyster sauce is cherished for its unique umami flavor, caramel color and viscous texture [1]. Later, it was industrially produced by employing fermentation that converts oysters’ protein into amino acids by the action of protease [2]. Nowadays, commercial oyster sauces are produced from oyster extract with brine, flavor enhancers, caramel coloring and chemical preservatives [1].
Oyster, as a raw material, contributes towards the unique flavor and high nutritional values of oyster sauces. Oysters are a rich source of protein, free amino acids, nucleotides, vitamins and certain minerals [2,3,4]. The free amino acids present in oyster sauce reported to exhibit antimutagenic, anti-obesity and antioxidant activity [5]. Taurine is a beta-sulfonic amino acid present in oyster sauces and mainly concentrated in brain, heart, retina and muscles. Taurine is associated with several crucial activities such as osmoregulation, neuro-regulation, antioxidation and anti-inflammatory [6,7]. Nucleotides are the important biological compounds that plays a significant role in metabolism at the cellular level. These compounds are mainly come from dietary sources and also produced in human liver [8].
The free amino acids and 5′-nucleotides are reported as taste compounds in the oyster sauce [1,2,9]. It was also mentioned that the taste receptors in mouth can only be stimulated by the smaller components, especially free amino acids and free nucleotides, rather than the proteins and nucleic acids [10]. The free amino acids can be divided into umami amino acids, bitter amino acids and sweet amino acids based on the taste characteristics [11]. It is also reported that the nucleotides, especially 5′-guanosine monophosphate (5′-GMP) and 5′-inosine monophosphate (5′-IMP) contribute towards the umami taste, while 5′-adenosine monophosphate (5′-AMP) responsible for the sweet taste and hypoxanthine (Hx) influence the bitterness of product [10-12]. The enhanced umami taste of oyster sauce is attributed to the synergy between the available free amino acids and nucleotides in the sauce [11].
Previously, researchers have analyzed the contaminants, sensory characteristics, chemicals and physical properties of oyster sauces from Korea, Vietnam and Thailand [1,13,14]. However, studies related to the oyster sauce products from China are limited.
It was observed different processing techniques employed to produce oyster sauces lead to variations in its sensory properties such as the commercial oyster sauce is darker, exhibit less fishy smell and thicker in texture compared to homemade oyster sauce. Thus, the present study is carried out to identify and quantify the nutrients and non-volatile flavor compounds including free amino acids, taurine and 5′-nucleotides in commercial and homemade oyster sauces from China. The findings of this study will provide reference data for consumers for the selection of better-quality oyster sauces and help the manufactures to provide quality products in the market.
Materials and methods
2.1. Oyster sauce products
Eighteen different types of oyster sauce samples including commercial and one homemade product were collected online and from local market of Zhuhai, Guangdong, China. The detailed information regarding the samples is shown in Table 1. The sample number 14 is a homemade oyster sauce. Whereas, the sample number 12, 13, 15 and 16 were prepared by traditional method, in which oyster juice or oyster broth was condensed to form oyster sauce.
2.2. Chemicals and reagents
Dansyl chloride, methylamine hydrochloride, taurine standard and nucleotide standards (5'-AMP and Hx) were procured from Shanghai Yuanye Biological Technology Co., Ltd. (Shanghai, China). Triethylamine and phenylisothiocyanate (PITC) were purchased from Shanghai Macklin Biochemical Co., Ltd. (Shanghai, China). The mixed amino acids standard was obtained from Tianjin Bonna - Agela Technologies Co., Ltd. (Tianjin, China). Whereas, the potassium dihydrogen phosphate, potassium ferrocyanide, zinc acetate, sodium carbonate and sodium acetate were procured from Nuoke Technology Development Co., Ltd. (Tianjin, China). Acetonitrile (HPLC grade) and methanol (HPLC grade) were purchased from Merck KGaA (Darmstadt, Germany).
2.3. HPLC analysis of taurine
2.3.1. Extraction and derivation of taurine
The taurine content of the oyster sauce samples was determined according to the national standard method [15]. Briefly, 0.5 g of sample was dissolved in 20 mL of deionized water followed by the addition of 1 mL potassium ferrocyanide solution (0.15 g/mL) and 1 mL zinc acetate solution (0.3 g/mL). This mixture was vortexed and diluted to 50 mL with deionized water followed by centrifugation at 10000 rpm for 5 min. Afterwards, 1 mL supernatant was derivatize with 1 mL sodium carbonate buffer solution (80 mmol/L, pH 9.5) and 1 mL dansyl chloride-acetonitrile solution (1.5 mg/mL). This mixture was kept in the dark for 2 h at room temperature followed by the addition of 0.1 mL methylamine hydrochloride solution (20 mg/mL). After complete precipitation, the resultant solution was filtered through 0.45 μm nylon syringe filter for HPLC analysis. The derivation of standard solutions was carried out simultaneously with the samples.
Table 1. Information of oyster sauce products *
| Code | Retail Price | Ingredients | Moisture(%) |
|---|---|---|---|
| 1 | ¥37.9/510g | Oyster juice (oyster, water, salt), sugar, salt, sodium glutamate, wheat flour, caramel, hydroxypropyl distarch phosphate. | 51.5 |
| 2 | ¥11.9/510g | Oyster juice (oyster, water, salt), sugar, salt, sodium glutamate, wheat flour, caramel, hydroxypropyl distarch phosphate. | 55.1 |
| 3 | ¥5.9/ 510g | Oyster juice (oyster, water, salt), sugar, salt, sodium glutamate, wheat flour, caramel, hydroxypropyl distarch phosphate, soy sauce, citric acid, stevioside. | 72.9 |
| 4 | ¥10.5/510g | Oyster juice (oyster, water, salt), disodium 5'-ribonucleotide,yeast extract,citric acid | 49.9 |
| 5 | ¥9.8/510g | Oyster juice (oyster, water, salt), disodium 5'-ribonucleotide, citric acid, potassium sorbate, xanthan gum. | 66.7 |
| 6 | ¥8.8/ 510g | Oyster juice (oyster, water, salt), disodium 5'-ribonucleotide, sodium glutamate, hydroxypropyl distarch phosphate, caramel, citric acid, potassium sorbate, xanthan gum. | 66.9 |
| 7 | ¥12.7/510g | Oyster juice (oyster, water, salt), sugar, salt, sodium glutamate, hydroxypropyl distarch phosphate, disodium 5'-ribonucleotide, yeast extract, caramel, citric acid, potassium sorbate. | 65.5 |
| 8 | ¥25.9/510g | Oyster juice (oyster, water, salt), sugar, salt, sodium glutamate, hydroxypropyl distarch phosphate, caramel, citric acid, potassium sorbate. | 50.5 |
| 9 | ¥25.7/510g | Oyster juice, water, sugar, modified starch, brown sugar, caramel, yeast extract, flavoring agents (E631), stabilizing agent (E415). | 45.4 |
| 10 | ¥8.9/ 510g | Water, soy sauce (soy bean, water, wheat flour, salt), oyster juice (oyster, water, salt), sugar, salt, sodium glutamate, hydroxypropyl distarch phosphate, caramel, citric acid, potassium sorbate, xanthan gum, acesulfame potassium. | 86.1 |
| 11 | ¥10.3/510g | Soy sauce (soy bean, water, wheat flour, salt), oyster juice (oyster, water, salt), sugar, salt, sodium glutamate, hydroxypropyl distarch phosphate, caramel, citric acid, potassium sorbate, xanthan gum, 5'-ribonucleotide. | 57.8 |
| 12 | $49.9/510g | Oyster juice (oyster, water, salt), sugar, salt, hydroxypropyl distarch phosphate, 5'-ribonucleotide | 62.9 |
| 13 | ¥39.9/510g | Shajin fresh oyster juice, water, starch, salt, caramel, sodium benzoate. | 65.2 |
| 14 | ¥54.8/510g | No information | 67.6 |
| 15 | ¥54.9/510g | Oyster juice (oyster, water, salt), sugar, salt, wheat starch, caramel, xanthan gum. | 58.4 |
| 16 | ¥79.8/510g | Oyster juice (oyster, water, salt), sugar, salt, hydroxypropyl distarch phosphate, 5'-ribonucleotide, sodium glutamate | 61.6 |
| 17 | ¥8.9/510g | Oyster juice (oyster, water, salt), water, fructose corn syrup, salt, hydroxypropyl distarch phosphate, sodium glutamate, caramel, wheat flour, xanthan gum, 5’-ribonucleotide, sodium benzoate, potassium sorbate. | 68.4 |
| 18 | ¥14.6/510g | Oyster juice (oyster, water, salt), water, soy sauce, sugar, salt, sodium glutamate, hydroxypropyl distarch phosphate, caramel, wheat flour, 5’-ribonucleotide. | 53.9 |
* Sample information is not disclosed due to potential conflict of interest.
2.3.2. Identification and quantification of taurine
The HPLC system (Agilent 1200, Agilent Technologies) equipped with Phenomenex, Luna 5u C18 column (250 mm x 4.6 mm, 5 μm) and an Agilent 1260 Infinity fluorescence detector were used to quantify the taurine in oyster sauce samples. 20 μL sample was used for analysis. The excitation and emission wavelength of detector were set at 330 and 530 nm, respectively. Solvent A (10 mmol/L, pH 4.2, sodium acetate buffer) and solvent B (acetonitrile) with a ratio of A: B = 70:30 (v: v) at a flow rate of 1 mL/min were employed as mobile phase. The standard curve of taurine was established by employing different concentration of taurine standard solutions (1, 2, 5, 10, 20, 50 ppm).
2.4. HPLC analysis of free amino acids
2.4.1. Extraction and derivation of free amino acids
HPLC analysis of free amino acids was carried out according to a previously described method with slight modifications [16,17]. Briefly, ultrasonic extraction of 1 g oyster sauce was carried out with 50 % ethanol for 30 min at 40°C. The supernatant was collected and mixed with 10 mL aqueous ethanol solution. The extraction process was repeated twice. Then, 1 mL supernatant was derivatized with 100 μL triethylamine acetonitrile and 100 μL PITC solution followed by incubation for 1 h at room temperature. Then, 400 μL hexane was added and mixed evenly for 2 min. The bottom layer solution was collected after 10 min and filtered through 0.22 μm PTFE syringe filter for HPLC analysis. The derivation of standard solutions was carried out simultaneously with the samples.
2.4.2. Identification and quantification of free amino acids
HPLC system (Agilent 1200, Agilent Technologies) equipped with Agilent 1200 photodiode array detector and Venusil AA C18 column (4.6 mm x 250 mm, 5 μm) was employed to quantify the free amino acids. The column temperature was set at 40 °C and wavelength of detector was set at 254 nm. The injection volume was 20 μL. The solvent A (10 mM sodium acetate buffer solution (pH 6.5)-acetonitrile; 18.5:1.4, v: v) and solvent B (80 % acetonitrile) with linear gradient elution at a flow rate of 1 mL/min were used as mobile phase. The gradient elution was performed as solvent A reduced from 100% to 92% at 0 to 15 min, 92% - 78% at 15 - 25 min followed by 78% - 64% at 25 - 36 min, 64% - 0% at 36 - 38 min, 0% at 38 - 43 min, then increased from 0% to 100% at 43 - 43.1 min and 100% at 43.1 - 50 min. The standard curve was established by using various injection volume (1, 2, 5, 10, 20 and 50 μL) of standard stock solution of mixed amino acid standard solution (2.5 mM).
2.5. HPLC analysis of 5'-nucleotides
Briefly, ultrasonic extraction of diluted oyster sauce (6 g) was carried out for 15 min at room temperature followed by centrifugation at 10,000 rpm for 10 min and filtration through 0.22 μm PES syringe filter. The HPLC system (Waters, e2695 Separations Module) equipped with Phenomenex Luna C18 column (4.6 mm x 250 mm, 5 μm) and photodiode array detector (Waters 2998) was used for analysis. The column temperature was set at 30 ̊C and detection wavelength was set at 254 nm. The sample injection volume was 10 μL. An isocratic elution mode was applied for the separation with a mobile phase 0.01 M potassium dihydrogen phosphate buffer (pH 4.68) at a flow rate of 0.8 mL/min for 26 min [11]. The standard curve was established by employing different concentrations (0.5, 1, 2, 5, 10, 20, 50, 100 ppm) of mixture of standard 5'-GMP, 5'-IMP, 5'-AMP and Hx.
2.6. Statistical analysis
HPLC analyses of taurine, free amino acids and 5'-nucleotides were performed in triplicates. The data were expressed as mean ± standard deviation by applying excel 2013 (Microsoft, Co., Ltd., Washington, U.S.A.). All data were statistically analyzed by employing One-Way (ANOVA) and the significant differences among the mean values of different parameters were evaluated by Duncan’s multiple range test by SPSS Statistics (25.0, IBM, Armonk, NY, U.S.A.).
Results
3.1 Taurine contents in oyster sauces
The HPLC chromatograms for taurine standard and sample are presented in Figure 1. The taurine standard was eluted at 6.664 min and the peak for taurine in sample was observed at 6.732 min. The taurine contents in 18 oyster sauce samples are shown in Table 2. The taurine content was calculated based on dry weight and wet basis. The taurine values on dry basis were two or three times higher compared to the values calculated on wet basis. In following section, various chemical components of sauce samples were expressed based on wet weight. A significant difference (p < 0.05) in the taurine contents of oyster sauce samples was observed except in case of sample 4, 5, 6 and samples 8 and 18. The highest taurine content (550.18 mg/100g) was observed in case of homemade oyster sauce sample 14. The taurine content of commercial sauces ranging from 452.21 mg/100g in sample 15 to 7.02 mg/100g in case of sample 3. It is interesting to note that the traditionally processed sauce samples 12, 13, 15 and 16 presented significantly higher amount of taurine compared to other commercial samples.
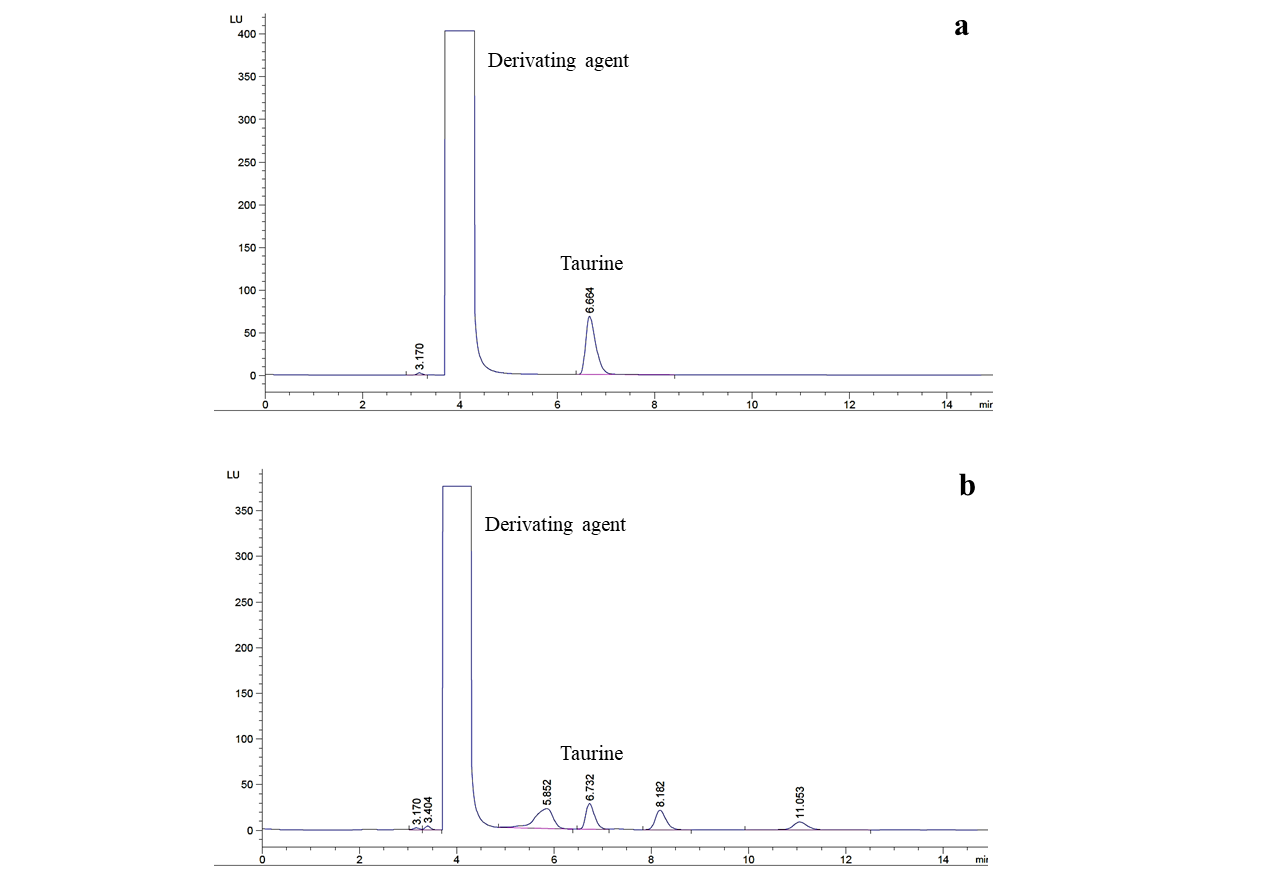
Figure 1: A typical HPLC chromatograms of (a) taurine standard and (b) sample.
Table 2. Taurine content of different oyster sauce products
| Sample | Taurine (mg/100g wet weight) | Taurine (mg/100g dry weight) |
|---|---|---|
| #1 | 124.36 ± 1.03f | 256.41 ± 2.12f |
| #2 | 52.67 ± 0.74c | 117.30 ± 1.65c |
| #3 | 7.02 ± 0.21a | 25.89 ± 0.77a |
| #4 | 17.72 ± 0.18b | 35.36 ± 0.36ab |
| #5 | 15.22 ± 0.39b | 45.71 ± 1.18b |
| #6 | 17.59 ± 0.24b | 53.13 ± 0.73b |
| #7 | 148.75 ± 2.89g | 431.15 ± 8.36g |
| #8 | 68.01 ± 1.45d | 137.39 ± 2.92d |
| #9 | 104.07 ± 0.63e | 190.60 ± 1.15e |
| #10 | ND | ND |
| #11 | 20.09 ± 0.04b | 47.61 ± 0.08b |
| #12 | 364.63 ± 6.72j | 982.84 ± 18.11j |
| #13 | 271.70 ± 2.77i | 780.75 ± 7.96i |
| #14 | 550.18 ± 7.44l | 1698.07 ± 22.98l |
| #15 | 452.21 ± 2.56k | 1087.05 ±6.15k |
| #16 | 229.41 ± 4.31h | 597.43 ± 11.22h |
| #17 | ND | ND |
| #18 | 71.90 ± 0.70d | 155.96 ± 1.51d |
Data are shown as mean ± standard deviation (n = 3); Different letters within a column (a-j) represent the statistically significant differences (p < 0.05) between the mean values. ND, not detected.
3.2. Free amino acids contents in oyster sauces
he HPLC chromatograms of standard amino acids and sauce sample are shown in Figure 2. The molecular weight, linear equation, retention time and correlation coefficient (R2) of 13 free amino acids are presented in Table 3.
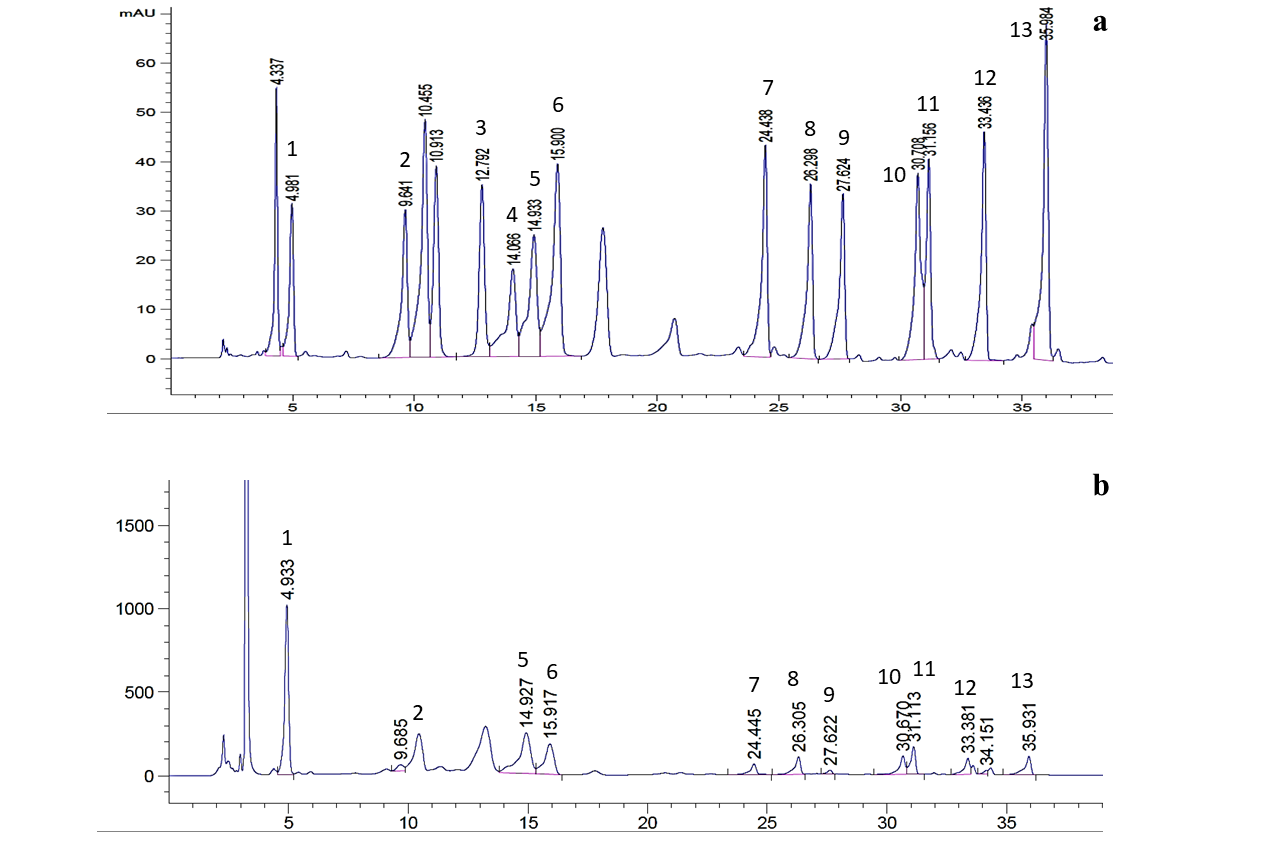
Figure 2: A typical HPLC chromatograms of (a) 13 standard amino acids and (b) sample; 1. Glu, 2. Ser, 3. Arg, 4. Thr, 5. Ala, 6. Pro, 7. Tyr, 8. Val, 9. Met, 10. Ile, 11. Leu, 12. Phe, 13. Lys
Table 3. The linear equation and correlation coefficient (R2) of free amino acids standards
| Amino acids | Molecular weight | Retention time | Linear equation | R2 |
|---|---|---|---|---|
| Glutamic acid (Glu) | 147.1 | 4.981 | y = 322.79x - 37.803 | 0.9998 |
| Serine (Ser) | 105.1 | 9.641 | y = 426.38x - 123.13 | 0.9994 |
| Arginine (Arg) | 174.2 | 12.792 | y = 399.87x - 71.941 | 0.9997 |
| Threonine (Thr) | 119.1 | 14.006 | y = 334.07x - 42.508 | 0.9999 |
| Alanine (Ala) | 89.1 | 14.933 | y = 340.9x - 47.584 | 0.9997 |
| Proline (Pro) | 115.1 | 15.900 | y = 771.01x + 38.84 | 0.9993 |
| Tyrosine (Tyr) | 119.1 | 24.438 | y = 549.54x - 123.53 | 0.9996 |
| Valine (Val) | 117.1 | 26.298 | y = 493.84x - 80.201 | 0.9999 |
| Methionine (Met) | 149.2 | 27.624 | y = 468.14x - 76.51 | 0.9998 |
| Isoleucine (Ile) | 131 | 30.708 | y = 646.88x - 96.986 | 1 |
| Leucine (Leu) | 131.2 | 31.156 | y = 437.58x - 67.09 | 0.9997 |
| Phenylalanine (Phe) | 165 | 33.436 | y = 608.99x - 102.77 | 0.9999 |
| Lysine (Lys) | 146.2 | 35.984 | y = 900.32x - 277.82 | 0.9991 |
Glutamic acid was the first amino acid to elute at 4.986 min and lysine was the last to elute at 35.973 min. The R2 of calibration curves were ranged from 0.9991 to 1. The free amino acids were classified as umami amino acid, sweet amino acids and bitter amino acids (Table 4 and 5). The average amount of glutamic acid was found to be the highest (754.66 mg/100g) followed by alanine (97.71 mg/100g), leucine (38.18 mg/100g), lysine (24.61 mg/100g)
Valine (21.35 mg/100g), phenylalanine (20.5 mg/100g), isoleucine (20.08 mg/100g), proline (19.69 mg/100g), threonine (19.27 mg/100g), serine (14.07 mg/100g), arginine (13.39 mg/100g), tyrosine (10.4 mg/100g), and methionine (8.06 mg/100g). The average amount of umami amino acid was 246.22% higher compared to the average of sum of other amino acids found in 18 oyster sauces. The proline and alanine contents in homemade oyster sauce were higher than the average amounts present in commercial oyster sauces. However, other amino acids were present in higher quantity in commercial oyster sauces. The percentage contents of umami amino acids, sweet amino acids and bitter amino acids in homemade oyster sauce were 50.78%, 38.66% and 10.55%, respectively. Whereas the commercial sauces exhibit 72.41% of umami amino acid, 15.62%of sweet amino acids and 11.97%of bitter amino acids.
Table 4. Umami and sweet amino acids contents in oyster sauces
| Sample | Sweet amino acids (mg/100g) | Umami amino acid (mg/100g) | Total amino acids (mg/100g) | ||||
|---|---|---|---|---|---|---|---|
| Ser | Thr* | Ala | Pro | Lys* | Glu | ||
| #1 | ND | ND | 25.38 ± 0.40f | 7.45 ± 0.08d | 9.38 ± 0.06bc | 1215.8 ± 13.6j | 1319 ± 14.55i |
| #2 | ND | ND | 20.13 ± 0.19e | 3.99 ± 0.18c | 9.53 ± 0.05bc | 934.7 ± 8.9i | 996.70 ± 9.46f |
| #3 | ND | 24.61 ± 0.18d | 15.11 ± 0.44d | 2.21 ± 0.21b | 23.21 ± 0.12fg | 938.9 ± 4.1i | 1106.36 ± 3.78g |
| #4 | 5.95 ± 0.28a | 76.41 ± 1.51f | 7.64 ± 0.39b | ND | 11.68 ± 0.05d | 1338.1 ± 81.5l | 1475.09 ± 79.74l |
| #5 | 5.34 ± 0.10a | 28.22 ± 0.49e | 9.89 ± 0.08bc | ND | 7.77 ± 0.03ab | 839.1 ± 39.1h | 932.74 ± 37.83e |
| #6 | 4.89 ± 0.02a | 21.11 ± 0.11b | 12.75 ± 0.10cd | 0.16 ± 0.013a | 7.08 ± 0.02a | 777.1 ± 8.0g | 864.37 ± 7.30d |
| #7 | 12.39 ± 0.16b | ND | 121.16 ± 1.28j | 3.89 ± 0.04ctd> | 16.50 ± 0.17e | 661.4 ± 9.1f | 927.43 ± 12.51e |
| #8 | 20.59 ± 0.07d | ND | 88.26 ± 0.26i | 6.97 ± 0.05d | 23.97 ± 0.03g | 560.1 ± 2.4e | 893.62 ± 2.65de |
| #9 | 17.95 ± 0.02c | 160.71 ± 0.47g | 49.91 ± 0.07g | 1.82 ± 0.01b | 11.34 ± 0.01cd | 17.2 ± 0.04a | 349.19 ± 1.31b |
| #10 | ND | ND | 2.35± 0.03a | ND | 6.82 ± 0.05a | 265.8 ± 5.1b | 288.01 ± 5.11a |
| #11 | 34.19 ± 0.40g | 23.51 ± 0.08c | 129.6 ± 0.27k | 33.52 ± 0.18g | 69.15 ± 0.80j | 858.7 ± 12.4h | 1410.75 ± 15.64jk |
| #12 | 25.35 ± 0.66e | ND | 260.06 ± 6.08n | 87.39 ± 0.53k | 46.38 ± 1.4i | 658.1 ± 16.2f | 1375.82 ± 30.93ijk |
| #13 | ND | ND | 143.48 ± 0.19l | 27.08 ± 0.03f | 10.59 ± 0.04 cd | 985.1 ± 3.4i | 1232.21 ± 3.95h |
| #14 | ND | ND | 225.06 ± 2.57m | 38.14 ± 0.56h | 21.83 ± 0.24f | 413.8 ± 7.6c | 784.87 ± 11.49c |
| #15 | ND | ND | 289.98 ± 2.78p | 17.84 ± 0.11e | 37.88 ± 0.40h | 467.7 ± 8.3d | 942.45 ± 11.57ef |
| #16 | 30.48 ± 1.18f | ND | 267.10 ± 2.09o | 62.98 ± 0.62j | 37.29 ± 0.51h | 765.28 ± 23.61g | 1415.92 ± 32.31jk |
| #17 | ND | ND | 20.52 ± 0.07e | ND | 8.30 ± 0.04ab | 1264.62 ± 8.31k | 1366.1 ± 8.77ij |
| #18 | 95.92 ± 3.44h | 12.27 ± 0.43a | 70.26 ± 3.0h | 60.99 ± 0.53i | 84.27 ± 3.38k | 622.3 ± 21.9f | 1434.52 ± 46.30kl |
Data are shown as mean ± standard deviation (n=3); Different letters within a column (a-p) represent the statistically significant differences (p < 0.05) between the mean values; ND, not detected; Ser, Serine; Thr, Threonine; Ala, Alanine; Pro, Proline; Lys, Lysine; Glu, Glutamic acid; *Essential amino acids. Total free amino acids: the summation of 13 free amino acids.
The glutamic acid content of homemade oyster sauce (413.8 mg/100g) was relatively lower compared to the most of commercial sauces. The commercial oyster sauces exhibit significant variation in glutamic acid ranging from 17.2 mg/100g in sample 9 to 1338.1 mg/100g in case of sample 4. The highest amount of threonine and alanine were detected in sample 9 (160.71 mg/100g) and sample 15 (289.98 mg/100g), respectively. Whereas, the highest amount of proline (87.39 mg/100g) and tyrosine (34.49 mg/100g) were observed in case of sample 12. It is interesting to note that sample 18 contain the highest amount of serine, arginine, valine, methionine, isoleucine, leucine, phenylalanine and lysine.
Table 5. Bitter amino acids contents in oyster sauces
| Bitter amino acids (mg/100g) | |||||||
|---|---|---|---|---|---|---|---|
| Sample | Arg | Tyr* | Val* | Met* | Ile* | Leu* | Phe* |
| #1 | ND | 3.68 ± 0.07bc | 5.84 ± 0.06e | ND | 17.51 ± 0.33h | 29.94 ± 1.07g | 4.08 ± 0.06a |
| #2 | 5.48 ± 0.05a | 3.28 ± 0.04ab | 3.45 ± 0.08bc | 2.99 ± 0.04a | 3.31 ± 0.04a | 6.08 ± 0.15b | 3.68 ± 0.03a |
| #3 | 14.57 ± 1.2b | 9.62 ± 0.10f | 14.99 ± 0.18g | 5.81 ± 0.10b | 16.19 ± 0.14g | 26.84 ± 0.62g | 14.22 ± 0.15d |
| #4 | ND | 6.91 ± 0.07d | 2.79 ± 0.09ab | 2.98 ± 0.03a | 5.02 ± 0.15b | 12.53 ± 0.60c | 5.06 ± 0.09a |
| #5 | 6.86 ± 0.44a | 3.72 ± 0.07bc | 4.89 ± 0.07de | 3.14 ± 0.03a | 4.42 ± 0.12ab | 14.37 ± 0.35cd | 5.08 ± 0.04a |
| #6 | 6.71 ± 0.05a | 3.92 ± 0.09c | 4.28 ± 0.06cd | 2.81 ± 0.04a | 4.14 ± 0.05ab | 15.47 ± 0.80cde | 4.05 ± 0.05a |
| #7 | 36.12 ± 0.5e | 9.10 ± 0.19f | 13.09 ± 0.28f | 6.94 ± 0.13b | 11.17 ± 0.19e | 26.75 ± 0.87g | 8.15 ± 0.04bc |
| #8 | 34.12 ± 0.2d | 14.14 ± 0.02g | 30.81 ± 0.38j | 13.38 ± 0.11e | 23.72 ± 0.03i | 55.42 ± 0.34i | 22.17 ± 0.30f |
| #9 | 28.19 ± 0.1c | 7.82 ± 0.17e | 12.06 ± 0.13f | 5.79 ± 0.33b | 8.91 ± 0.02d | 18.27 ± 0.34ef | 9.18 ± 0.14c |
| #10 | 5.62 ± 0.04a | 2.79 ± 0.03a | 1.95 ± 0.02a | ND | ND | 2.69 ± 0.05a | ND |
| #11 | ND | 7.85 ± 0.08e | 55.44 ± 0.57m | 15.86 ± 0.07f | 56.20 ± 0.55l | 96.32 ± 0.42l | 30.43 ± 0.39g |
| #12 | ND | 34.49 ± 0.44j | 53.73 ± 1.34l | 17.94 ± 0.45g | 50.22 ± 1.24k | 89.32 ± 2.81k | 52.87 ± 0.81i |
| #13 | ND | 7.02 ± 0.17d | 17.58 ± 0.24h | 9.12 ± 0.46c | 7.73 ± 0.04c | 16.99 ± 0.40de | 7.55 ± 0.36cd |
| #14 | ND | 9.31 ± 0.08f | 17.66 ± 0.51h | 6.75 ± 0.31b | 12.63 ± 0.12f | 21.09 ± 0.28f | 18.56 ± 1.25f |
| #15 | ND | 13.59 ± 0.19g | 24.85 ± 0.27i | 11.57 ± 0.14d | 23.82 ± 0.58i | 37.40 ± 1.03h | 17.81 ± 1.14h |
| #16 | ND | 26.59 ± 0.93i | 50.30 ± 0.92k | 19.67 ± 1.44h | 44.19 ± 0.19j | 71.82 ± 3.44j | 40.22 ± 0.17h |
| #17 | ND | ND | ND | ND | ND | 13.93 ± 0.37cd | 58.73 ± 1.14ab |
| #18 | 102.98 ± 3.0f | 23.43 ± 0.50h | 70.51 ±1.96n | 20.22 ± 1.77h | 72.21 ± 1.77m | 131.96 ± 4.02m | 67.14 ± 1.94k |
Data are expressed as mean ± standard deviation (n=3); Different letters within a column (a-n) represent the statistically significant differences (p < 0.05) between the mean values; Arg, Arginine; Tyr, Tyrosine; Val, Valine; Met, Methionine; Ile, Isoleucine; Leu, Leucine; Phe, Phenylalanine; ND, not detected; *Essential amino acids.
3.3. 5'-Nucleotides contents in of oyster sauces
The HPLC chromatograms of 5'-nucleotides standards and samples are presented in Figure 3. 5'-GMP (9.584 min) was the first nucleotide to elute followed by 5'-IMP (10.697 min), Hx (12.824 min) and 5'-AMP (22.847 min).
The linear equations and correlation coefficients of standard 5'-nucleotides are shown in Table 6. The correlation coefficient of standard5'-nucleotides were ranged from 0.9993 to 1. A significant difference was observed in all 5'-nucleotides content of oyster sauce samples under investigation. The homemade sauce (sample 14) contain was 5.46 mg/100g of 5'-GMP, 5.72 mg/100g of 5'-IMP and 6.09 mg/100g of Hx. However, 5'-AMP was not observed in sample 14. Significant variation was also observed among the nucleotide contents of commercial oyster sauces. The highest content of 5'-GMP (172.52 mg/100g) and 5'-IMP (204.22 mg/100g) was observed in sample 4. Whereas the highest amount of Hx (17.79 mg/100g) and 5'-AMP (18.44 mg/100g) were observed in case of sample 12 and sample 7, respectively. In addition, the lowest amount of 5'-GMP (0.28 mg/100g), 5'-IMP (1.20 mg/100g), Hx (0.63 mg/100g) and 5'-AMP (1.34 mg/100g) were found in sample 1, 3, 6 and 5, respectively. However, 5'-nucleotides were not found in sample 10. The average value of 5'-GMP (41.60 mg/100g) and 5'-IMP (50.70 mg/100g), was observed to be significantly higher compared to the average value of Hx (4.47 mg/100g) and 5'-AMP (4.22 mg/100g).
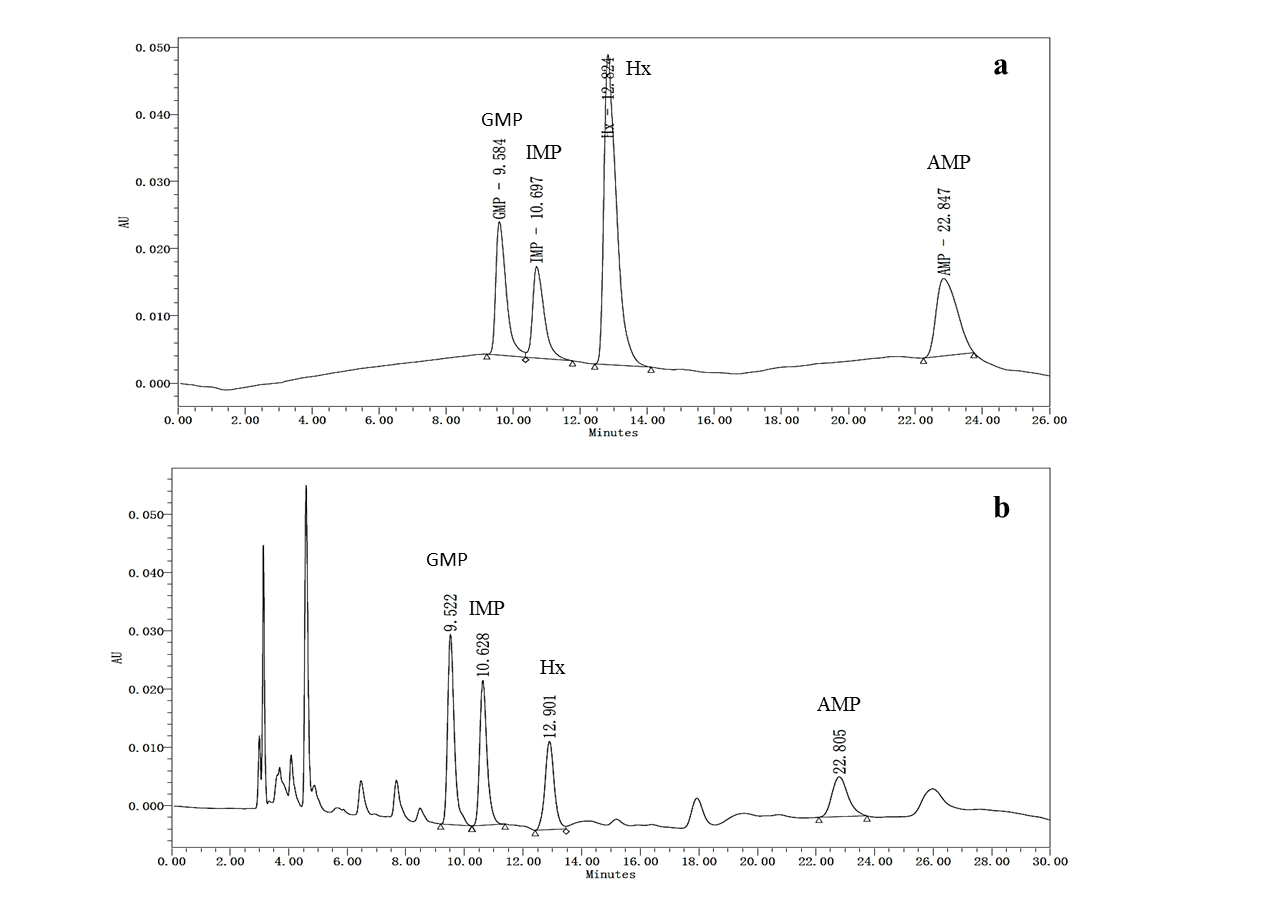
Figure 3: A typical HPLC chromatograms of 5’-nucleotides in standard (a) and sample (b).
Table 6. The linear equation and correlation coefficient (R2) of nucleotide standards
| Nucleotides | Retention time | Linear equation | R2 |
|---|---|---|---|
| 5'-GMP | 9.584 | y= 20134x + 4911.5 | 0.9998 |
| 5'-IMP | 10.697 | y= 14644x + 5447.8 | 0.9993 |
| Hx | 12.824 | y= 59550x + 2864.9 | 1.0000 |
| 5'-AMP | 22.847 | y= 20833x + 16480 | 0.9991 |
5'-GMP, 5'-guanosine monophosphate; 5'-IMP, 5'-inosine monophosphate; 5'-AMP, 5'-adenosine monophosphate; Hx, hypoxanthine.
Discussion
4.1. Taurine profile in oyster sauces
Taurine, a free amino acid, exhibit various biological functions and available in oyster in significant amount. Taurine is vital for brain development and reported to present cytoprotection. It acts as an organic osmolyte associated with cell volume regulation [7] by providing compounds for the synthesis of bile salt [18]. The HPLC pre-column derivation of taurine by dansyl chloride resulted in high-resolution peak and accurate analysis of this compound. In this study, homemade oyster sauce presents higher amount of taurine compared to the commercial samples. A significant difference in the taurine content was also observed among all the samples except sample 4, 5, 6 and 11. The potential variation in these values may be due to difference in processing technologies and raw materials. Generally, fermentation or proteolysis is applied to produce oyster sauce. Previously, researchers have mentioned stable taurine content
during different fermentation periods [2]. Therefore, the variations in the taurine content of oyster sauces may be attributed to the oyster species or total amount of oyster used as a raw material for preparation and processing. In case of sample 10 and 17, taurine content was not detected even after increasing the sample weight. The potential reason behind this may be the loss of taurine while processing or most probably due to the replacement of oyster extract with other ingredient or additives. The oyster sauce sample 14, 15 and 12 are found to be rich sources of taurine.
4.2. Free amino acids profile in oyster sauces
HPLC pre-column derivation by PITC leads to high accuracy and resolution of peaks in chromatograms. Amino acids are reported to be responsible for the unique taste of oyster sauces [11]. Three types of taste amino acids namely, umami, sweet and bitter amino acids were detected in this study. The total free amino acids content in homemade oyster sauce was lower compared to its mean value in commercial sauces while proline and alanine contents in homemade sauce were higher. The highest amount of total free amino acids was observed in sample 4. Besides, sample 11, 12, 13, 16 and 17 also present significantly higher amounts of total free amino acids. Whereas sample 10 presented the lowest amount of total free amino acids.
The percentage compositions of umami, sweet and bitter amino acids observed in different oyster sauces are shown as Figure 4(a). Previous studies suggested that umami taste of the sauce is due to the presence of glutamic acid, the sweet
taste is contributed and threonine, while arginine, tyrosine, valine, methionine, isoleucine, leucine and phenylalanine are responsible for the bitter taste of oyster sauce, fish sauce and seafood [1,10,11]. Amino acids are also reported to exhibit synergistic effect on taste along with other compounds. [18] reported an enhancement in umami flavor of sodium chloride and monosodium glutamate in presence of phenylalanine and tyrosine.
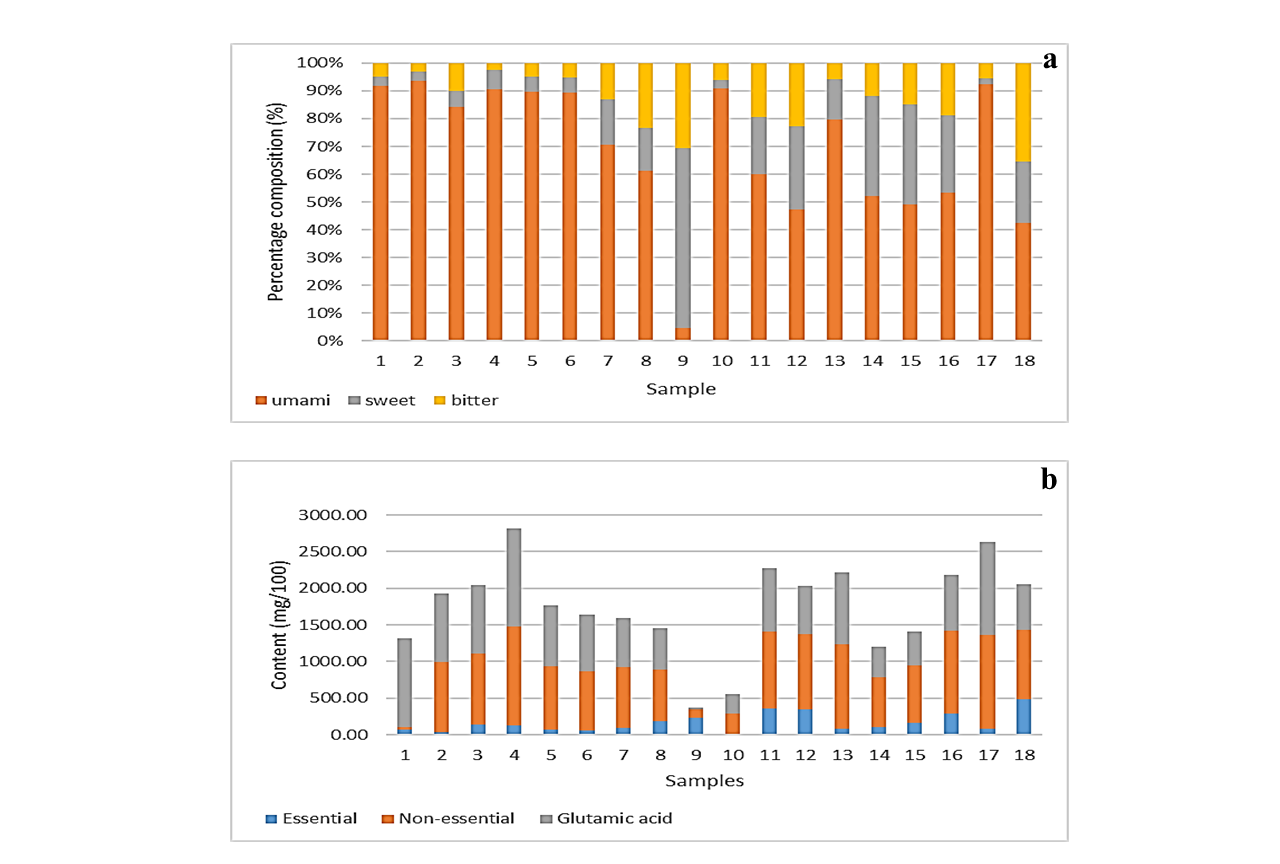
Figure 4: Profiles of oyster sauces (a) presenting percentage distribution of umami, sweet and bitter amino acids in oyster sauces (b) the amounts of essential, non-essential amino acids and glutamic acids in oyster sauces
Glutamic acid, responsible for umami taste, was found to be a predominant free amino acid in both commercial and homemade oyster sauces. The average percentage distribution of glutamic acid among 18 oyster sauces in total free amino acids was observed to be 71.1%. However, previous studies have reported much lower glutamic acid percentage composition of free amino acids in raw oyster (25.8%) and fermented oyster (24.4%) compared to present study [2,18]. The high percentage distribution of glutamic acid possibly due to the addition of monosodium glutamate (MSG) in oyster sauce that react with PITC due to its structural similarity with glutamic acid.
The percentage distribution of umami amino acid in sample 1 to 6 and in sample 10, 13 and 17 was higher than 80%. In case of other samples, except sample 9, the percentage distribution of umami amino acid varies from 40% to 70% (Figure 4a). Generally, the distribution of sweet amino acids was slightly higher compared to the bitter amino acids. It is interesting to note that the percentage composition of sweet amino acids in sample 9 was much higher compared to the umami amino acids. The lower amount of glutamic acid in sample 9 may be due to the replacement of MSG with disodium inosinate (E631) as a flavoring agent, while the high percentage composition of sweet amino acids and bitter amino acids in oyster sauce might be affected by the selection of raw material (oysters) and addition of yeast extract.
Essential amino acids namely, threonine, tyrosine, valine, methionine, leucine, isoleucine, phenylalanine and lysine are vital for maintaining biochemical functions in human body.
Dietary intake of these amino acids is necessary as human body can’t synthesize them in sufficient quantity [20]. The amounts of essential amino acids, non-essential amino acids and glutamic acid in sauce samples are presented in Figure 4(b). Glutamic acid was reported individually rather than being mentioned along with non-essential amino acids because its content might be interfered by the MSG. The sample 18, 11, 12 and 16 found to be a good source of essential amino acids, whereas sample 17 present the lowest levels of essential amino acids. However, sample 2 and 10 present least amounts of essential amino and sample 4, 13 and 17 exhibits the highest amount of non-essential amino acids. Overall, the highest amount of total amino acid (1475.09 mg/100g) was observed in case of sample 4, whereas the lowest amount (288.01 mg/100g) was found in sample 10.
4.3. 5'- Nucleotides profile in oyster sauces
Nucleotides such as 5'-GMP, 5'-IMP and 5'-AMP reported to significantly contribute towards the umami taste and flavor of sauce [11]. In particular, 5'-GMP and 5'-IMP responsible for the meaty flavor of food product [21]. Besides, imparting umami taste in oyster, 5'-AMP is also responsible for the sweet taste along with suppressing the bitter flavor of seafood products [11,12] whereas, Hx is responsible for the bitterness to food [11].
As shown in Table 7, 5'-GMP and 5'-IMP were the predominant nucleotides in oyster sauces. Whereas samples under investigation contain less amount 5'-AMP and Hx were compared to 5'-GMP and 5'-IMP. Thus, the umami taste of oyster sauces was mainly contributed by 5'-GMP and 5'-IMP. The higher amounts of 5'-GMP and 5'-IMP were found in sample 4, 7, 8 and 18, while these compounds were not detected in sample 2, 3 and 10. Hx was not available in sample 10 and 17, whereas other samples presented a small amount of Hx. 5'-AMP was detected in only 9 oyster sauce samples. 5'-Nucleotides contents in homemade oyster sauce were significantly lower compared to the commercial samples except sample 15. Moreover, significant differences in the 5'-nucleotides were also observed among commercial oyster sauces. Overall, sample 4 present the highest total nucleotides contents. However, nucleotides were not detected in sample 10. The potential factors responsible for the variation in 5'-nucleotides content may be the differences in the processing techniques and selections of oyster spices.
Table 7. 5'-Nucleotides contents in different oyster sauce products
| Sample | GMP(mg/100g) | IMP(mg/100g) | Hx(mg/100g) | AMP(mg/100g) | Total5'-Nucleotides (mg/100g) |
|---|---|---|---|---|---|
| #1 | 0.28 ± 0.002a | ND | 3.02 ± 0.03c | ND | 3.30±1.47a |
| #2 | ND | ND | 0.99 ± 0.05b | ND | 0.99±0.50a |
| #3 | ND | 1.20 ± 0.08a | 0.83 ± 0.06b | ND | 2.03±0.61a |
| #4 | 172.52 ±2.37l | 204.22 ± 2.99j | 1.16 ± 0.08b | 3.26 ± 0.07b | 381.16±108.26h |
| #5 | 57.44 ± 1.36g | 66.83 ± 2.65f | 0.94 ± 0.02b | 1.34 ± 0.02a | 126.55±35.42de |
| #6 | 61.34 ± 3.61h | 66.01 ± 0.54f | 0.63 ± 0.01ab | 2.84 ± 0.15b | 130.82±35.82de |
| #7 | 127.80 ±1.22k | 177.38 ± 1.18i | 6.85 ± 0.08g | 18.44 ± 0.27h | 330.47±83.43g |
| #8 | 95.82 ± 2.18j | 94.84 ± 3.61h | 3.05 ± 0.29c | 5.77 ± 0.27c | 199.48±52.51f |
| #9 | 19.06 ± 0.21d | 24.01 ± 0.16d | 2.56 ± 0.21c | ND | 45.63±11.91c |
| #10 | ND | ND | ND | ND | ND |
| #11 | 17.43 ± 0.29d | 20.45 ± 0.38c | 4.97 ± 0.20e | ND | 42.85±9.79c |
| #12 | 43.77 ± 0.53f | 68.35 ± 1.05f | 17.79 ± 0.33h | 13.63 ± 0.38g | 143.54±25.42e |
| #13 | 19.07 ± 0.60d | 22.68 ± 0.90cd | 3.82 ± 0.08d | 6.82 ± 0.32d | 52.39±9.18c |
| #14 | 5.46 ± 0.25b | 5.72 ± 0.41b | 6.09 ± 0.40f | ND | 17.27±2.89b |
| #15 | 1.85 ± 0.15a | 1.43 ± 0.04a | 15.29 ± 1.22i | ND | 18.57±7.14b |
| #16 | 34.62 ± 0.15e | 45.54 ± 1.53e | 7.41 ± 0.28gh | 12.80 ± 0.72f | 100.37±18.01d |
| #17 | 13.72 ± 0.32c | 22.96 ± 0.43cd | ND | ND | 36.68±11.24bc |
| #18 | 78.59 ± 1.75i | 91.38 ± 3.12g | 5.08 ± 0.24e | 10.99 ± 0.29e | 186.04±44.80f |
Data are expressed as mean ± standard deviation (n=3); Different letters within a column (a-k) represent the statistically significant differences (p < 0.05) between the mean values; 5'-GMP, 5'-guanosine monophosphate; 5'-IMP, 5'-inosine monophosphate; 5'-AMP, 5'-adenosine monophosphate; Hx, hypoxanthine; ND, not detected.
4.4. Potential improvements
Except for glutamic acid, the potential reasons behind the lower amounts of total free amino acids of samples are poor fermentation, selection of raw materials, amounts of oyster used and processing methods. For instance, the traditional processing method that involves the concentration of oyster juice or oyster broth by employing moderate boiling was applied in homemade oyster sauce [1]. Fermentation was not involved in this process that protects the protein present in oyster sauce from degradation. The homemade oyster sauce and several commercial oyster sauces namely, sample 12, 13, 15 and 16 revealed the application of traditional processing method in the preparation of these samples. The finding of this study proved the claim of employing traditional methods for preparing these sauce samples. However, majority of the commercial oyster sauces were prepared by employing a small amount of oyster extracts with poor fermentation, addition of salt, sugar, flavoring agents and stabilizing agents that, in turn, result into a reprocessed oyster sauce [1]. For instance, in case of sample 10, taurine, 5'-nucleotides and majority of free amino acids were not found which indicate that this product is prepared by a combination of various additives. Some of the commercial oyster sauces were economically affordable but consumers have to compromise with the quality. For quality improvement of such products, manufactures should focus on the selection of better raw products.
Furthermore, several potential improvements in the design of experiment can also be employed. The present study was designed to identify and quantify 17 free amino acids. For the same, initially, mixture of 17 amino acids standards was used, but four amino acids namely, aspartic acid, glycine, histidine and cystine were not considered. Later, the results of only 13 amino acids were reported. Aspartic acid was well separated from the mixture of standard solution, but its retention time was not stable. Whereas, the peaks of glycine and histidine were overlapped at lower concentration but both amino acids were very well separated at higher concentration. In case of cystine, the peak can only be detected within certain time range after derivation that may be attributed to the instability of cystine-PITC derivative. The contents of glutamic acid might be representing the amounts of both MSG and glutamic acid as PITC can’t distinguish between these two compounds due to their structural similarity. Furthermore, composition and gradient of mobile phases can be optimized [22] for detection of aspartic acid, glycine and histidine, alteration in the derivating agent can be done for analyzing cystine and the amino acid analyzer can be employed for analyzing glutamic acid [21]. In case of 5'-nucleotides, the peak for 5'-AMP was not as sharp as observed in case of other nucleotides. The peak for 5'-AMP can be improved by changing the mobile phases composition and elution gradient [22].
Sensory evaluation can be conducted for the verification of taste and flavor contributed by non-volatile components in oyster sauces. Previous studies suggested that synergistic effect of free amino acids and 5'-nucleotides enhance the umami taste and mask the bitterness contributed by valine and hypoxanthine [11,21,23]. The synergistic effect of these compounds can also be evaluated by the sensory evaluation of oyster sauces. Furthermore, monosodium glutamate equivalent (EUC), the amount of monosodium glutamate required for contributing the same umami intensity, can be also used to measure the synergistic effect between free amino acids and 5'-nucleotides [11, 21]. The value is calculated by employing the concentration of umami amino acid and 5'-nucleotides in sample. The calculation of EUC was not used in this study as the glutamic acid content might be presenting MSG and unconfirmed contents of aspartic acid. EUC calculation can be mentioned in the future study by calculating precise glutamic acid and aspartic acid content.
Conclusions
In present study, taurine, thirteen free amino acids and four 5'-nucleotides in 18 commercial and homemade oyster sauce samples were identified and quantified. Significant differences were observed in the taurine, free amino acids and 5'-nucleotides of 18 oyster sauces. The higher amount of taurine was observed in case of sauce samples processed by condensation of oyster juice or oyster broth. Umami amino acid contributed towards the major proportion of total free amino acids, while the percentage of sweet amino acids were slightly higher compared to the bitter amino acids except in case of sample 9. Sample 11, 12, 16 and 18 were found to be a good source of essential amino acids. Among 5' -nucleotides, 5'-GMP and 5'-IMP were the major contributors towards the umami taste of oyster sauces. It was also observed that several commercial oyster sauces are composed of chemical additives rather than using oyster extract. Whereas, some of the commercial oyster sauces were consistent with the claims of being processed by using traditional method. Furthermore, several potential improvements in the design of experiments and methods were discussed that must be considered in future studies in this field.
Acknowledgements: This research was jointly supported by two research grants (R202007 and R202107) from Beijing Normal University-Hong Kong Baptist University United International College, China.
Conflict of interest statement: The authors declare that there are no conflicts of interest.
Authors’ Contributions: Xiaotong Bai conducted the study, analyzed data, and drafted the manuscript. Maninder Meenu verified data, drafted and revised the manuscript. Prof. Baojun Xu designed and supervised the project and revised the manuscript.
References
- Nguyen THD, Wang XC. (2012) Volatile, taste components, and sensory characteristics of commercial brand oyster sauces: Comparisons and relationships. Int J Food Prop. 15(3): 518-535. [Ref.]
- Je JY, Park PJ, Jung WK, Kim SK. (2005) Amino acid changes in fermented oyster (Crassostrea gigas) sauce with different fermentation periods. Food Chemistry. 91(1): 15-18. [Ref.]
- Jiang S, Liu L, Xu J, Zeng M, Zhao Y. (2019) Amino acid composition and digestibility of Pacific oyster (Crassostrea gigas) proteins isolated from different parts. LWT-Food Sci Techol.116: 108591. [Ref.]
- Yuasa M, Kawabeta K, Eguchi A, Abe H, Yamashita E,et al. (2018) Characterization of taste and micronutrient content of rock oysters (Crassostrea nippona) and Pacific oysters (Crassostrea gigas) in Japan. Int J Gastron Food Sci. 13: 52-57. [Ref.]
- Allison DB, Gadbury G, Schwartz LG, Murugesan R, Kraker JL, et al. (2003) A novel soy-based meal replacement formula for weight loss among obese individuals: A randomized controlled clinical trial. Eur J Clin Nutr. 57: 514-522. [Ref.]
- Moon PD, Kim MH, Lim HS, Oh HA, Nam SY,et al. (2015) Taurine, a major amino acid of oyster, enhances linear bone growth in a mouse model of protein malnutrition. BioFactors. 41(3): 190-197. [PubMed.]
- Ripps H, Shen W. (2012) Review: Taurine: A “very essential” amino acid. Mol Vis. 18: 2673-2686. [Ref.]
- Dong M, Qin L, Xue J, Du M, Lin SY, et al. (2018) Simultaneous quantification of free amino acids and 5′-nucleotides in shiitake mushrooms by stable isotope labeling-LC-MS/MS analysis. Food Chem. 268: 57-65. [PubMed.]
- Nakano M, Sagane Y, Koizumi R, Nakazawa Y, Yamazaki M,et al. (2017) Data on the chemical properties of commercial fish sauce products. Data Brief. 15: 658-664. [PubMed.]
- Mouritsen OG, Duelund L, Calleja G, Frøst MB. (2017) Flavour of fermented fish, insect, game, and pea sauces: Garum revisited. Int J Gastron Food Sci. 9: 16-28. [Ref.]
- Wang Y, Li C, Li L, Yan X., Chen S, et al. (2019) Application of UHPLC-Q/TOF-MS-based meta-bolomics in the evaluation of metabolites and taste quality of Chinese fish sauce (Yu-lu) during fermentation. Food Chem. 296: 132-141. [PubMed.]
- Jinap S, Ilya-Nu A, Tang SC, Hajeb P, Shahrim K, et al. (2010) Sensory attributes of dishes containing shrimp paste with different concentrations of glutamate and 5’-nucleotides. Appetite. 55(2): 238-244. [PubMed.]
- Ting PAN, Lei Y, Ke ZHU, Wen LI, Zhuang GUO. (2016) Quality evaluation of commercial oyster sauce samples. Sci Tech Food Ind. 20: 96-100. [Ref.]
- Wong KO, Cheong YH, Seah HL. (2006) 3-Monochloropropane-1,2-diol (3-MCPD) in soy and oyster sauces: Occurrence and dietary intake assessment. Food Control. 17(5): 408-413. [Ref.]
- GB5009.169. (2016) Determination of tauine in food. National Standard of Food Safety. [Ref.]
- Huang G, Cai W, Xu B. (2017) Improvement in beta-carotene, vitamin B2, GABA, free amino acids and isoflavones in yellow and black soybeans upon germination. LWT - Food Sci Technol.75: 488-496. [Ref.]
- Xu L, Du B, Xu B. (2015) A systematic, comparative study on the beneficial health components and antioxidant activities of commercially fermented soy products marketed in China. Food Chemistry. 174: 202-213. [Ref.]
- Asha KK, Anandan R, Mathew S, Lakshmanan PT. (2014) Biochemical profile of oyster Crassostrea madrasensis and its nutritional attributes. Egypt J Aquat Res. 40(1): 35-41. [Ref.]
- Lioe, HN, Apriyantono A, Takara K, Wada K, Yasuda M. (2004) Umami taste enhancement of MSG/NaCl mixtures by subthreshold L-α-aromatic amino acids. Sensory Nutri Qual Food.70: 401-405. [Ref.]
- Song J, Liu C, Li D, Gu Z. (2013) Evaluation of sugar, free amino acid, and organic acid compositions of different varieties of vegetable soybean (Glycine max [L.] Merr). Ind Crops Prod. 50: 743-749. [Ref.]
- Zhang N, Wang W, Li B, Liu Y. (2019) Non-volatile taste active compounds and umami evaluation in two aquacultured pufferfish (Takifugu obscurus and Takifugu rubripes). Food Biosci. 32: 100468. [Ref.]
- Meenu M, Sharma A, Guha P, Mishra S. (2016) A Rapid High-Performance Liquid Chromatography Photodiode Array Detection Method to Determine Phenolic Compounds in Mung Bean (Vigna radiata L.). Int J Food Prop. 19: 2223-2237. [Ref.]
- Li W, Gu Z, Yang Y, Zhou S, Liu Y, et al. (2014) Non-volatile taste components of several cultivated mushrooms. Food Chem. 143: 427-431. [PubMed.]