>Corresponding Author : Randall S. Williamson
>Article Type : Research Article
>Volume : 1 | Issue : 2
>Received Date : 1 October, 2021
>Accepted Date : 25 October, 2021
>Published Date : 23 November, 2021
>DOI : https://doi.org/10.54289/JDOE2100106
>Citation : Nobles KP, Pal P, Janorkar AV, Williason RS. (2021) PEEK as a Potential Material for Dental Implants and its Biomechanical Properties and Osteoblast Cell Response. J Dent Oral Epidemiol 1(2). doi http://doi.org/10.54289/JDOE2100106
>Copyright : © 2021 Nobles KP, et al. This is an open-access article distributed under the terms of the Creative Commons Attribution License, which permits unrestricted use, distribution, and reproduction in any medium, provided the original author and source are credited.
Research Article | Open Access | Full Text
Department of Biomedical Materials Science, School of Dentistry, University of Mississippi Medical Center, 2500 N State St, Jackson, MS 39216, United States
*Corresponding author: Randall S. Williamson, Department of Biomedical Materials Science, School of Dentistry, University of Mississippi Medical Center, 2500 N State St, Jackson, MS 39216, United States
Abstract
Proper osseointegration is crucial for the success of dental and orthopedic implants. Titanium-6Aluminum-4Vanadium (TAV) is one of the most popular implant materials; however, polyetheretherketone (PEEK) has gained the interest of implant researchers and manufacturers over the past several years due to its lower modulus of elasticity compared to metallic implant materials. Porosity and patterned surface morphologies are thought to improve mechanical interlocking and play an important role in the differentiation of pre-osteoblasts into mature osteoblasts. This study aimed to determine the effects a macro patterned PEEK surface has on the material’s mechanical properties and the proliferation, differentiation, and maturation of pre-osteoblasts. Mechanical testing data indicated that the macro patterning improved the mechanical interlocking and has no detrimental effect on compression strength. DNA data and live/dead imaging showed that pre-osteoblasts on solid PEEK specimens did not readily differentiate but instead encouraged proliferation only. However, ALP data in comparison to the DNA data showed that cells on patterned PEEK specimens more readily entered the differentiation pathway to mineralization. This is further confirmed by the patterned PEEK specimens showing an overall higher amount of cell mineralization. Clinical significance: This study concludes that surface macro patterning of PEEK material increases the mechanical interlocking and enhances the osseointegration capability without diminishing mechanical properties.
Keywords: PEEK, Osseointegration, Mechanical Testing, Macro Patterned Surface, Surface Modification
Abbreviations: TAV: Titanium-6Aluminum-4Vanadium, PEEK: polyetheretherketone, sPEEK: surface PEEK, pPEEK: surface patterned PEEK, ALP: alkaline phosphatase.
1. Introduction
Osseointegration occurs at the interface between bone and an implant surface, which is crucial for the success of long-term implants [1-3]. About 5% of dental and 10% of orthopedic implants fail due to aseptic loosening caused by poor osseointegration [2-4].Titanium-6Aluminum-4Vanadium (TAV) is a popular implant material used in load bearing dental and orthopedic applications because of its biocompatibility and excellent mechanical properties, such as tensile strength, elastic modulus, and resistance to fatigue
fracture [5,6]. TAV displays great corrosion resistance and low toxicity; however, widespread research has been conducted to improve the bioactivity of TAV to enhance its osseointegration capability [5,6]. Natural bone has an elastic modulus of only 0.1 - 30 GPa; therefore, the 100 - 110 GPa elastic modulus of TAV can cause stress shielding, due to modulus mismatch, and lead to premature failure of an implant [7,8]. Furthermore, metallic implants have been shown to cause a variety of artifacts during magnetic resonance imaging (MRI) and may cause scattering of x-rays, which may be harmful to surrounding tissues [9-11].
PEEK has become a popular alternative to TAV and other metallic implants in an effort to reduce stress shielding, overcome MRI artifacts, and reduce x-ray scattering [12-15]. Another advantage of PEEK over metallic implants is PEEK’s radiolucency, which allows for better observation of the healing phase since the material does not cause any MRI artifacts [10,16]. PEEK has been used limitedly in dentistry as an implant superstructure, abutment, and as an implant fixture [10]. PEEK has an elastic modulus range from 3 to 8 GPa and has a compound structure that helps to disperse the masticatory forces of dental implants [10,16,17]. However, it has been reported that unmodified PEEK is less bioactive than titanium, thereby also needing surface modification to improve biomaterial-tissue interactions [18-22].
Multiple studies have shown that porous and/or patterned surface morphologies can enhance the adhesion, proliferation, and differentiation of osteoblasts on titanium and PEEK surfaces [19,23-26]. Also, an implant having a roughened or patterned surface can lead to strong mechanical interlocking and insure implant stability [19,27]. Furthermore, the pattern morphology, size, interconnectivity, and chemical composition are important parameters that influence the osteoblast cellular response to surfaces [25,28]. To allow for proper vascularization, nutrient transport, and
bone ingrowth the pattern should contain pores that are interconnected and range from 100 to 700 µm in size [28-31].
Recent research has suggested that cells receive osteogenic cues from certain topographical features that are on the micro- and nano- scale [32,33]. This has led to the implementation of patterning surfaces, mostly on polymeric surfaces, in order to enhance bone growth [32-34]. Macroscale and microscale features are typically used to improve mechanical interlocking and enhance biological responses, while nanoscale features are thought to provide specific cues that regulate cellular responses [35-37]. Most often in the literature, the macroscale range is above 100 µm, the microscale range is from 1 - 10 µm, and the nanoscale features range from 1 - 100 nm [38-40].
In this study we evaluated the mechanical properties of macro patterned PEEK and the effect the pattern had on pre-osteoblast proliferation, differentiation, and mineralization. These effects were observed through surface characterization and biochemical characterization. The research hypothesis evaluated was that patterning of PEEK would improve mechanical interlocking, cellular adhesion, and promote more cellular differentiation and mineralization compared to smooth surface PEEK.
2. Materials and Methods
2.1.1 Materials
PEEK specimens were provided by Zavation Medical Products, LLC (Flowood, MS). The specimens arrived pre-prepared with either an as machined smooth surface or a patterned surface as shown in Figure 1. The specimens were disk shaped with a diameter of 12.7 mm and a thickness of 2 - 3 mm and had the following two group configurations: smooth surface PEEK (sPEEK) and surface patterned PEEK (pPEEK).
2.1.2 Specimen Sterilization
The specimens were sterilized by autoclave for 30 minutes at 120 °C. The specimens were transferred to 24 - well plates using proper aseptic techniques for cell culture studies.
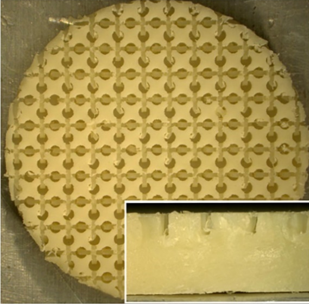
Figure 1: Digital image of the patterned PEEK specimen. Enlarged image is the side view of the specimen.
2.2 Surface Characterization
2.2.1 Atomic Force Microscopy and Roughness Measurements
Atomic Force Microscopy (AFM, Bioscope Catalyst, Bruker, Santa Barbara, CA) was used to determine the surface roughness (Ra) values of the sPEEK specimens. The pPEEK specimen’s machined surfaces had a height differential that was greater than could be measured with the AFM. The 50 µm x 50 µm area scans were acquired in ScanAssyst mode (0.100-0.25 Hz, and 512 samples/line) and analyzed by the Gwyddion software (Version 2.41). The patterned specimens were not able to be scanned using AFM due to their highly tortuous surfaces. Instead, the height of each patterned area was measured using a VHX digital microscope (Keyence Corp., Osaka, Japan), which equates to the roughness of the surface.
2.2.2 Pattern Measurements
The pattern on the pPEEK surface was measured for pore size, channel length, and channel width using a VHX digital microscope (Keyence Corp., Osaka, Japan).
2.2.3 Wettability
Contact angle analysis was conducted on the sPEEK specimens using distilled water to determine the hydrophilicity of the material type. The patterned specimens were tested but due to the surface structure resulted in complete wettability or the absorption of the water into the pores and channels of the pattern. All measurements were performed at ambient room temperature using 3 µL droplets of distilled water. Images were captured using a VHX digital microscope (Keyence Corp., Osaka, Japan) and water contact angles were analyzed using the Keyence software.
2.3 Mechanical Testing
2.3.1 Expulsion Testing
Expulsion testing was conducted on both patterned and smooth PEEK samples (N = 6) according to ASTM Draft F04.25.02.02 with an MTS (MTS, Eden Prarie, MN) Sintech 2/G Load Frame. An aluminum fixture was manufactured to hold the sample in between two grade 15 polyurethane foam test blocks. The implant was seated in the polyurethane foam blocks and an axial preload of 500 N was then applied to the construct. The test fixture was then oriented 90° to the direction of axial force application. A displacement rate of 6 mm/min was applied to a load applicator to the implant forcing it out of the polyurethane foam blocks. The ramp was continued until the foam test blocks fractured at the mounting screw holes before forcing the implant out of the foam blocks or the load continued to lower. Force (N) and displacement (mm) data were recorded. Maximum expulsion force was recorded as the peak force.
2.3.2 Compression Testing
Static compression testing was conducted on both patterned and smooth PEEK samples (N = 6) according to ASTM F2077-17 Test Methods for Intervertebral Body Fusion Devices with an MTS 810 load frame (MTS, Eden Prairie, MN). The static compression samples were tested with stainless steel inserts at a displacement rate of 2 5 mm/min until failure in room temperature air. Load vs. Displacement graphs were produced from the data and stiffness (N/mm), yield force (N), displacement at yield (mm), ultimate force (N), and ultimate displacement (mm) were calculated.
2.4 In Vitro Characterization
2.4.1 Cell Culture
MC3T3-E1 mouse pre-osteoblastic cells (American Type Culture Collection, Manassas, VA) were maintained and expanded at 37°C and 5% CO2 in alpha-modified Eagle’s minimum essential medium supplemented with, L-glutamine, sodium pyruvate, 10% fetal bovine serum, and 1 % penicillin-streptomycin with the pH adjusted to 7.4. An osteogenic media was made from Dulbecco’s modified eagle medium, 10% fetal bovine serum, 10 nM dexamethasone, 50 mM L-ascorbic acid, and 10 mM β-glycerophosphate and 1% penicillin/streptomycin. Approximately 30,000 cells/speci-men were seeded and acclimatized for a day. Thereafter, the cell-seeded specimens were supplemented with 1 mL of the osteogenic media every 48 hours of culture for up to 21 days.
2.4.2 Live/Dead Imaging
Cell viability on each specimen surface was imaged on day 21 using a Live/Dead assay kit (ThermoFisher) following manufacture’s protocol. Briefly, the cell-seeded specimens were washed with PBS and incubated with 4 µM EthD-1 and 2 µM calcein AM. The Live/Dead images were captured using an Olympus IX81 (Olympus America, Center Valley, PA) epifluorescence microscope analyzed using Slidebook image analysis software.
2.4.3 Biochemical Analysis
The cells were harvested from the specimens after specific time points: day 1, 7, 14, and 21. At each time point, the specimens were rinsed with PBS and the attached cells were trypsinized, collected, and stored at -80 °C. The collected cells were then lysed by sonicating for 1 min at 10% amplitude. All assays were conducted in triplicates.
2.4.4 Cell Proliferation
The cell proliferation was measured using a DNA quantification assay (CyQUANT™, ThermoFisher) according to the manufacturers’ protocol. A Biotek FLx800 plate reader (Winooski, VT, USA) was used to measure the fluorescence at an excitation wavelength of 460 nm and an emission wavelength of 520 nm.
2.4.5 Cell Differentiation
Cell differentiation was quantified using protein and alkaline phosphatase (ALP) assays. A BCA total protein assay (ThermoFisher Scientific) was used to measure total protein content, and absorbance at 540 nm was measured with a Biotek ELx800 plate reader (Winooski, VT, USA). For ALP quantification a QuantiChrom ALP assay kit (BioAssay Systems, Hayward, CA, USA) was used according to the manufacturers’ protocol. The absorbance was measured at 405 nm using an ELX-800 absorbance plate reader (Biotek, Winooski, VT).
2.4.6 Cell Mineralization
To quantify the amount of calcium deposition on each sample, which verifies maturation and mineralization of the pre-osteoblasts, Alizarin Red staining was utilized on day 21 via osteogenesis quantitation kit (EMD Millipore, Billerica, MA, USA). Initially, the specimens were fixed with 4% paraformaldehyde, followed by incubation in Alizarin Red stain solution for 20 min. The specimens were then washed, and the stained mineral deposits were imaged using a VHX digital microscope (Keyence Corp., Osaka, Japan). For quantifying the mineral deposits, the cell layer was dissolved using acetic acid, and the Alizarin Red stain was extracted. The absorbance was read at 405 nm using an ELX-800 absorbance plate reader.
2.5 Statistical Analysis
Statistical analysis was done using R software, a Shapiro-Wilk normality test was conducted in order to determine the normality of the data. If the data was normal a Levene’s test was used to determine if the data had equal variances. If the data met all the assumptions, then an ANOVA with Tukey’s post hoc was used and if the data did not meet the assumptions a Kruskal-Wallis rank sum test followed by pairwise comparisons using Wilcoxon rank sum test was used. A p-value of 0.05 was used as statistical significance. Mechanical testing data was analyzed using a Man-Whitney test in Minitab®.
3. Results and Discussion
3.1 Surface Characterization
The objectives of this study were to determine the difference in mechanical properties between sPEEK and pPEEK and to determine if a macro pattern on PEEK would stimulate osteoblast mineralization. Atomic Force Microscopy (AFM) and the VHX digital microscope were used to determine the roughness of the sPEEK and pPEEK. The average roughness value of the sPEEK specimens are shown in Table 1. There is an obvious significant height difference seen between the specimens due to the patterning, However, the top surface of the pattern is assumed to have the same roughness as the sPEEK samples given that these patterned surfaces were machined in the same method. The measurements of the pPEEK pattern were done using the VHX digital microscope and the channel width, length, and the diameter of the circular portion of the pattern were measured. The average diameter was 476.5 4.1 µm and the average width and length were 195 13.8 µm and 608.5 30.4 µm, respectively. Figure 2 shows the wetting angle results for the sPEEK specimens. The sPEEK specimen had an average wetting angle around 40° which indicates a relatively hydrophilic surface. The pPEEK also readily took on water during contact angle testing indicating that the pattern on the surface does not have a high surface tension and has a high wettability. The surface roughness and hydrophilic nature of both PEEK surfaces are within the reported values in the literature for improved osseointegration [41-43].
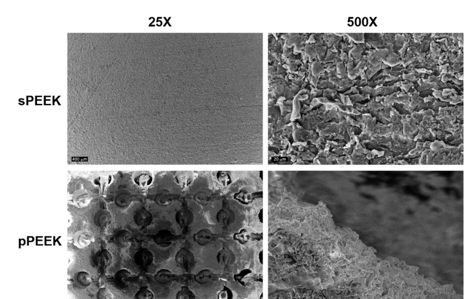
Figure 2:SEM images at 25x and 500x of sPEEK and pPEEK.
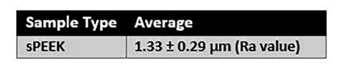
Table 1: Roughness value of the sPEEK specimens.
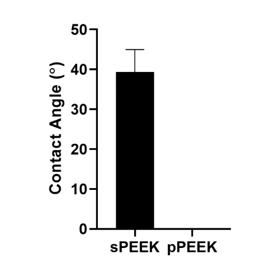
Figure 3:Contact angle analysis done on sPEEK and pPEEK. pPEEK specimen showed complete wettability within the pattern matrix.
3.2 Mechanical Testing
Expulsion testing is typically conducted on spinal implant body materials to measure the ability of the implant to resist movement in the body. The resistance of the implant to move is a combination of several variables including implant design, surface roughness, and the material’s coefficient of friction. Non-modified PEEK (smooth surface) has a low coefficient of friction of approximately 0.10 - 0.17, which allows it to move easier in the body compared to titanium which has a coefficient of friction of approximately 0.36 [16]. Expulsion testing was completed on the smooth and patterned PEEK in this study to determine if the patterned surface would decrease the ability of the material to move within the body. Expulsion and compression results are shown in Figure 3. Expulsion data shows that the patterned PEEK specimens had a significantly higher peak expulsion load (474 N) over the smooth PEEK specimens (362 N). This indicates that the patterning would have significant mechanical interlocking capabilities in vivo as either a dental or a spinal implant.
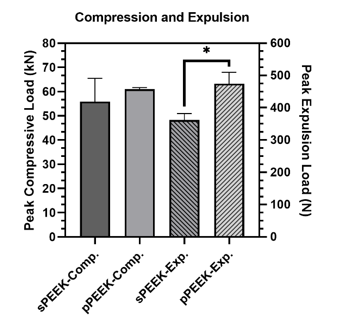
Figure 4:Peak loads for compression testing and expulsion testing. The * indicates significant difference of p < 0.05.
One of the major concerns with metallic implants is the phenomenon of stress shielding due to a mismatch in stiffness of bone and the implant material. PEEK is reported to have a Young’s modulus of elasticity range of 3-8 GPa which is close to that of natural bone [16]. Bone stiffness is a difficult quantitative value to determine because human beings are not homogenous. Differences in age, gender, physical condition, type of bone and many other factors influence the stiffness. The purpose of the compression testing for this research was not to compare the properties of the PEEK material to bone but to compare the properties between the smooth and patterned surfaces. The compression peak load is shown in Figure 3 and the data is tabulated in Table 2. Compression testing data showed similar values between sPEEK and pPEEK indicating that the patterned surface has no significant effect on the overall compression strength of PEEK. Stiffness values for the sPEEK were significantly higher than for pPEEK; however, all values are sufficient for implant use. This decrease in stiffness of the patterned PEEK was hypothesized to come from the initial crushing of the patterned PEEK columns into the valleys of the surface. There were no significant differences found for the force or displacement values at yield and ultimate. This data indicates the patterning on the PEEK surface does not negatively impact the mechanical strength of the material. Another concern for dental implants is the ability of the material to withstand mastication without failure. Mastication has been shown in the literature to have a wide range of force due to the difficulty of accurately measuring it, differences between different locations in the mouth, and the variability of humans (age, gender, physical ability, etc.) [17]. The range of values measured from strain-gage devices is reported to be in the range of 446 N to 1221 N [17]. The patterned and smooth PEEK samples had yield load values of 20,360 N and 20,440 N, respectively, which are significantly higher than the highest bite force reported.
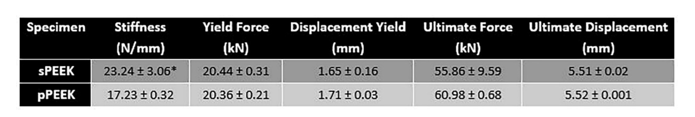
Table 2: Average values for the compression testing of smooth and patterned PEEK. The * indicates significant difference of p < 0.05.
3.3 In Vitro Characterization
When observing the DNA content data and the live/imaging data, it appears that the solid PEEK specimens were more favorable for cell proliferation and did not readily switch from proliferation to the differentiation phase. This conclusion is corroborated by the images shown below in Figure 4, which represent qualitatively, living cells present on the specimens at day 21. The corresponding images that stain the dead cells red showed very little, if any, dead cells on the specimens (images not shown). This could possibly be attributed to the sPEEK surface, while being hydrophilic in nature with an average contact angle of 40°, was still more hydrophobic than the pPEEK specimens which had complete wetting. Kennedy et al. had similar findings after testing hydrophobic gradient slides, having contact angles ranging from 25° to 95°, that were immersed in human fibronectin [44]. The researchers observed that cell proliferation was higher on the more hydrophobic surfaces after 64 hours [44].
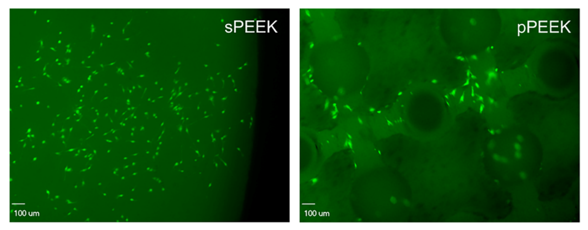
Figure 5: The images shown represent the cells that are alive (green) on each specimen type.
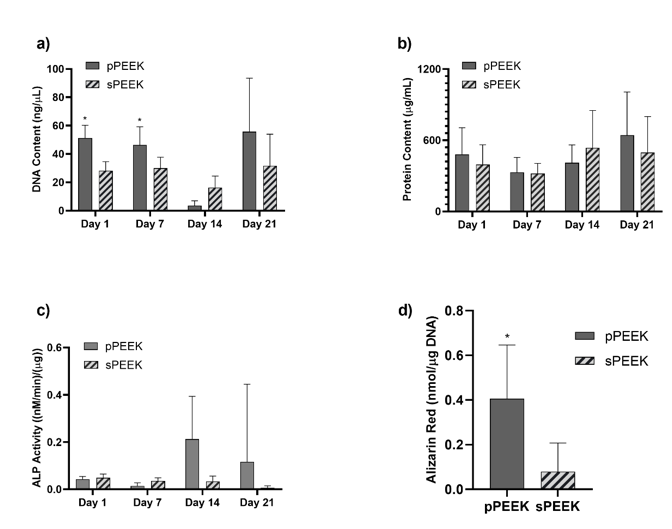
Figure 6: Graph (a) represents data from the DNA assay. Graph (b) shows protein content on each specimen type. Graph (c) shows ALP activity for each specimen. Graph (d) shows total Alizarin Red present on the specimen types. The * indicates significant difference of p < 0.05 for that specific timepoint.
Data obtained from the DNA assays and the live/dead imaging indicated that both sample types were biocompatible in vitro. Figure 5, graph (a), quantitatively confirms the presence of DNA on both PEEK specimens. DNA content is significantly higher on the pPEEK specimens for Day 1 and Day 7. However, qualitatively there seems to be a drop in total DNA content for both specimen types on Day 14 which could indicate a shift to cellular differentiation instead of proliferation. Total protein content is relatively the same for both specimen types at each time point. However, this data does confirm the presence of protein on each specimen type with possible increases on Day 14 and Day 21. ALP activity of the pre-osteoblast cells is shown in Figure 5, graph (c), which shows an increasing trend of the pPEEK specimens from Day 14 to Day 21 indicating a shift from proliferation to differentiation. This shift also corresponds to the DNA data obtained in graph (5a) and the day 21 live/dead imaging in Figure 4. The Alizarin Red data in Figure 5, graph (d), shows that pPEEK significantly outperforms the sPEEK in having more overall mineralization. This data corresponds with the downshift in DNA for the pPEEK on Day 14 and increase in ALP activity on Day 14 for the pPEEK. This information indicates that the pre-osteoblasts more readily underwent differentiation during the 21-day period on the pPEEK specimen type and therefore had more overall osteoblast mineralization by the end of the study. A study done by Civantos et al. investigated the affects different porosity ranges had on cellular reactions [30]. The research group studied titanium specimens having pore sizes of 100-200 µm, 250-355 µm, and 355-500 µm and observed a higher ALP activity by day 7 for all porous specimen types compared to a dense non-porous specimen indicating that the pre-osteoblastic MC3T3 cells have a higher affinity for the porous surfaces [30]. These findings are similar to the data in this study pertaining to the patterned PEEK specimens which had an average diameter pore of 476.5 µm aiding in more ALP activity observed and higher overall mineralization.
5. Conclusion
MC3T3-E1 pre-osteoblasts were successfully cultured on smooth and macro patterned PEEK specimens. Both specimen types were biocompatible in vitro and experienced cellular proliferation, with the pPEEK specimens experiencing more differentiation to mineralization by the day 21 time point. It was concluded from the results that the patterned specimens supported a more rapid mineralization of osteoblast cells. Surface characterization revealed significant differences between the specimen types and the mechanical testing data showed sufficient, and for expulsion data, superior results for the pPEEK. While it is understood that surface characteristics such as roughness, porosity, and hydrophilicity play a role in promoting cellular reactions and bone growth, the specific mechanisms and measurements needed for optimal osseointegration are not fully known. Future testing with different patterns having varying levels of surface measurements and future animal studies may help to further this research. Overall, this is a promising step forward in the understanding of the properties and characteristics that are beneficial to enhance and promote rapid osseointegration and lead to successful long-term dental and orthopedic implants.
Acknowledgements: We would like to acknowledge Zavation Medical Products, LLC for providing the grant (UMMC #SP11172) and material to support this research. This research made use of The University of Mississippi Medical Center’s Biomedical Materials Science shared equipment facility.
References
- Parithimarkalaignan S., Padmanabhan TV. Osseointegration:An update. J Indian Prosthodont Soc. 2013;13(1):2-6. [PubMed.]
- Raphel J.,Holodniy M., Goodman SB., Heilshorn SC. Multifunctional coatings to simultaneously promote osseointegration and prevent infection of orthopaedic implants. Biomaterials. 2016;84:301-314. [PubMed.]
- Albrektsson T., Brånemark PI., Hansson HA., Lindström J. Osseointegrated titanium implants:Requirements for ensuring a long-lasting., direct bone-to-implant anchorage in man. Acta Orthop. 1981;52(2):155-170. [PubMed.]
- Raphel J., Karlsson J., Galli S., Wennerberg A., Lindsay C., et al. Engineered protein coatings to improve the osseointegration of dental and orthopaedic implants. Biomaterials. 2016;83:269-282. [PubMed.]
- Wu C., Ramaswamy Y., Gale D., Yang W., Xiao K., et al. Novel sphene coatings on Ti-6Al-4V for orthopedic implants using sol-gel method., Acta Biomater. 2008;4(3):569-576. [Ref.]
- Kang JI., Son MK., Choe HC., Brantley WA. Bone-like apatite formation on manganese-hydroxyapatite coating formed on Ti-6Al-4V alloy by plasma electrolytic oxidation. Thin Solid Films. 2016;620:126-131. [Ref.]
- Long M., Rack HJ. Titanium alloys in total joint replacement - A materials science perspective. Biomaterials. 1998;19(18):1621-1639. [Ref.]
- Sun YS., Huang HH. Biphasic calcium phosphates/tantalum pentoxide hybrid layer and its effects on corrosion resistance and biocompatibility of titanium surface for orthopedic implant applications. J Alloys Compd. 2018;743:99-107. [Ref.]
- Hargreaves BA., Worters PW., KB Pauly., JM Pauly., KM Koch., et al. Metal-induced artifacts in MRI. Am J Roentgenol. 2011;197(3;547-555. [PubMed.]
- Mishra S., Chowdhary R. PEEK materials as an alternative to titanium in dental implants:A systematic review. Clin. Implant Dent Relat Res. 2019;21(1;208-222. [PubMed.]
- Ozen J., Dirican B., Oysul K., Beyzadeoglu M., Ucok O., et al. Dosimetric evaluation of the effect of dental implants in head and neck radiotherapy. Oral Surgery Oral Med Oral Pathol Oral Radiol Endodontology. 2005;99(6):743-747. [PubMed.]
- Vogel D., Dempwolf H., Baumann A., Bader R. Characterization of thick titanium plasma spray coatings on PEEK materials used for medical implants and the influence on the mechanical properties. J Mech Behav Biomed Mater. 2018;77:600-608. [PubMed.]
- Li J., Qin L., Yang K., Ma Z., Wang Y., et al. Materials evolution of bone plates for internal fixation of bone fractures:A review. J Mater Sci Technol. 2020;36:190-208. [Ref.]
- Miyazaki T., Matsunami C., Shirosaki Y. Bioactive carbon–PEEK composites prepared by chemical surface treatment. Mater Sci Eng C. 2017;70(1):71-75. [Ref.]
- Hahn BD., Park DS., Choi JJ., Ryu J., Yoon WH., et al. Osteoconductive hydroxyapatite coated PEEK for spinal fusion surgery. Appl Surf Sci. 2013;283:6-11. [Ref.]
- Knaus J., Schaffarczyk D., Cölfen H. On the Future Design of Bio-Inspired Polyetheretherketone Dental Implants. Macromol Biosci. 2020;20(1). [Ref.]
- Koc D., Dogan A., Bek B. Bite Force and Influential Factors on Bite Force Measurements:A Literature Review. Eur J Dent. 2010;4(2):223-232. [Ref.]
- Zheng Y., Liu L., Xiao L., Zhang Q., Liu Y. Enhanced osteogenic activity of phosphorylated polyetheretherketone via surface-initiated grafting polymerization of vinylphosphonic acid., Colloids Surfaces B Biointerfaces. 2019;173:591-598 [Ref.]
- Torstrick FB., Lin ASP., Potter D., Safranski DL., Sulchek TA., et al. Porous PEEK improves the bone-implant interface compared to plasma-sprayed titanium coating on PEEK. Biomaterials. 2018;185:106-116. [PubMed.]
- Durham JW., Montelongo SA., Ong JL., Guda T., Allen MJ., et al. Hydroxyapatite coating on PEEK implants:Biomechanical and histological study in a rabbit model. Mater Sci Eng C. 2016;68. 2016):723-731. [Ref.]
- Poulsson AHC., Eglin D., Zeiter S., Camenisch K., Sprecher C., et al. Osseointegration of machined., injection moulded and oxygen plasma modified PEEK implants in a sheep model. Biomaterials. 2014;35. 2014):3717-3728. [PubMed.]
- Evans NT., Torstrick FB., Lee CSD., Dupont KM., Safranski DL., et al. High-strength., surface-porous polyether-ether-ketone for load-bearing orthopedic implants. Acta Biomater. 2015;13(2015):159-167. [Ref.]
- Chen XB., Li YC., Du Plessis J., Hodgson PD., Wen C. Influence of calcium ion deposition on apatite-inducing ability of porous titanium for biomedical applications. Acta Biomater. 2009;5(5):1808-1820. [Ref.]
- Rosa AL., Crippa GE., De Oliveira PT., Taba M., Lefebvre LP., et al. Human alveolar bone cell proliferation., expression of osteoblastic phenotype., and matrix mineralization on porous titanium produced by powder metallurgy. Clin Oral Implants Res. 2009;20(5):472-481. [PubMed.]
- Tian Y., Ding S., Peng H., Lu S., Wang G., et al. Osteoblast growth behavior on porous-structure titanium surface. Appl Surf Sci. 2012;261:25-30. [Ref.]
- Ghosh R., Chanda S., Chakraborty D. The influence of macro-textural designs over implant surface on bone on-growth: A computational mechanobiology based study. Comput Biol Med. 2020;124:103937. [PubMed.]
- Cordioli G., Majzoub Z., Piattelli A., Scarano A. Removal torque and histomorphometric investigation of 4 different titanium surfaces:an experimental study in the rabbit tibia. Int J Oral Maxillofac Implants. 2000;15:668-74. [Ref.]
- Do Prado RF., De Oliveira FS., Nascimento RD., De Vasconcellos LMR., Carvalho YR., et al. Osteoblast response to porous titanium and biomimetic surface:In vitro analysis. Mater Sci.Eng C. 2015;52:194-203. [PubMed.]
- pu Zheng J., Jian Chen L., Yuan Chen D., Sheng Shao C., fei YI M., et al. Effects of pore size and porosity of surface-modified porous titanium implants on bone tissue ingrowth. Trans Nonferrous Met Soc China. 2019;29(12):2534-2545. [Ref.]
- Civantos A., Domínguez C., Pino RJ., Setti G., Pavón JJ., et al. Designing bioactive porous titanium interfaces to balance mechanical properties and in vitro cells behavior towards increased osseointegration., Surf. Coatings Technol. 2019;368:162-174. [Ref.]
- Liu B., Chen L., Shao C., Zhang F., Zhou K., et al. Improved osteoblasts growth on osteomimetic hydroxyapatite/BaTiO3 composites with aligned lamellar porous structure. Mater Sci Eng C. 2016;61(2016):8-14. [Ref.]
- Fransiska S., Ho MH., Li CH., Shih JL., Hsiao SW., et al. To enhance protein production from osteoblasts by using micro-patterned surfaces. Biochem Eng J. 2013;78(2013):120-127. [Ref.]
- Lenhert S., Meier MB., Meyer U., Chi L., Wiesmann HP. Osteoblast alignment., elongation and migration on grooved polystyrene surfaces patterned by Langmuir-Blodgett lithography. Biomaterials. 2005;26(5):563-570. [Ref.]
- Koegler WS., Griffith LG.;Osteoblast response to PLGA tissue engineering scaffolds with PEO modified surface chemistries and demonstration of patterned cell response. Biomaterials. 200425(14):2819-2830. [PubMed.]
- Coelho PG., Jimbo R., Tovar N., Bonfante EA. Osseointegration:Hierarchical designing encompassing the macrometer., micrometer., and nanometer length scales. Dent Mater. 2015;31(1):37-52. [Ref.]
- Davies JE., Ajami E., Moineddin R., Mendes VC. The roles of different scale ranges of surface implant topography on the stability of the bone/implant interface. Biomaterials. 2013;34. 14):3535-3546. [Ref.]
- Stewart C., Akhavan B., Wise SG., Bilek MMM. A review of biomimetic surface functionalization for bone-integrating orthopedic implants:Mechanisms., current approaches., and future directions. Prog Mater Sci. 2019;106. 2019). [Ref.]
- Dohan Ehrenfest DM., Coelho PG., Kang BS., Sul YT., Albrektsson T. Classification of osseointegrated implant surfaces:Materials., chemistry and topography. Trends Biotechnol. 2010;28(4):198-206. [Ref.]
- Skoog SA., Kumar G., Narayan RJ., Goering PL. Biological responses to immobilized microscale and nanoscale surface topographies. Pharmacol Ther. 2018;182(2018):33-55. [Ref.]
- Huang Z., Wan Y., Zhu X., Zhang P., Yang Z., et al. Simultaneous engineering of nanofillers and patterned surface macropores of graphene/hydroxyapatite/polyetheretherketone ternary composites for potential bone implants. Mater Sci Eng C. 2021;123. 2021). [Ref.]
- Gittens RA., Olivares-Navarrete R., Schwartz Z., Boyan BD. Implant osseointegration and the role of microroughness and nanostructures:Lessons for spine implants. Acta Biomater. 2014;10(8):3363-3371. [Ref.]
- Aparicio C., Padrós A., Gil FJ. In vivo evaluation of micro-rough and bioactive titanium dental implants using histometry and pull-out tests. J Mech Behav Biomed Mater. 2011;4(8):1672-1682. [Ref.]
- Wei J., Igarashi T., Okumori N., Igarashi T., Maetani T., et al. Influence of surface wettability on competitive protein adsorption and initial attachment of osteoblasts. Biomed Mater. 2009;4. 4). [Ref.]
- Kennedy SB., Washburn NR., Simon CG., Amis EJ. Combinatorial screen of the effect of surface energy on fibronectin-mediated osteoblast adhesion., spreading and proliferation. Biomaterials. 2006;27(20):3817-3824. [Ref.]